|
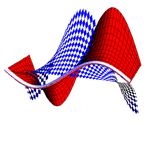
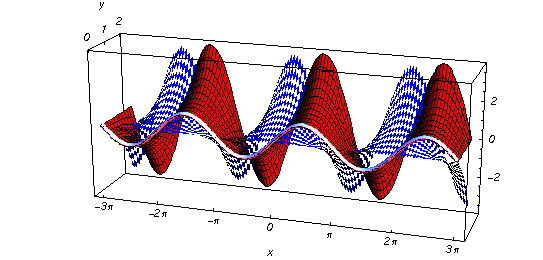
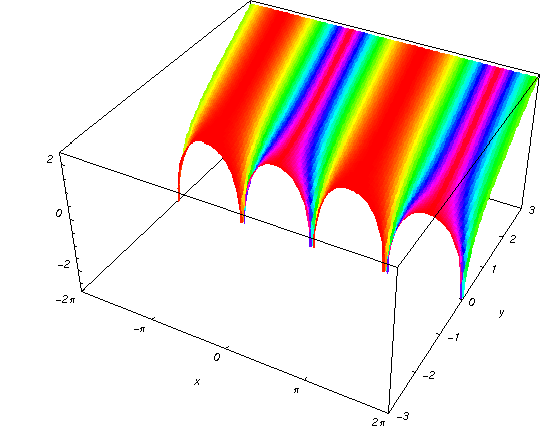
Entering the complex plane  in the in the  near the real axis. Here the complex variable near the real axis. Here the complex variable  is expressed as is expressed as  . The red surface is the real part of . The red surface is the real part of  . The blue, semitransparent surface is the imaginary part of . The blue, semitransparent surface is the imaginary part of  . The pink tube is the function . The pink tube is the function  along the real axis. Along the real axis, the real part of along the real axis. Along the real axis, the real part of  is oscillating; going away from the real axis into the is oscillating; going away from the real axis into the  its absolute value is generically an exponentially increasing function. Along the real axis, the imaginary part of its absolute value is generically an exponentially increasing function. Along the real axis, the imaginary part of  vanishes identically; going away from the real axis into the vanishes identically; going away from the real axis into the  its absolute value is generically an exponentially increasing function. its absolute value is generically an exponentially increasing function.
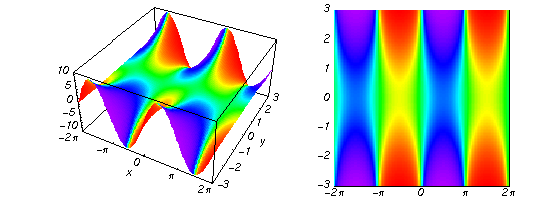
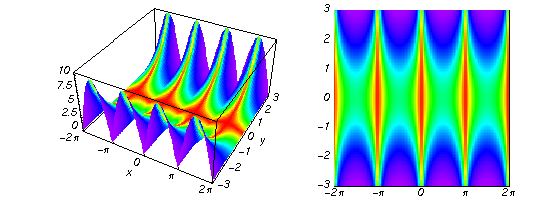
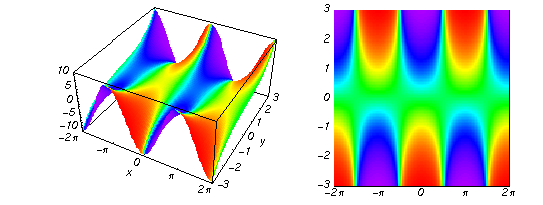
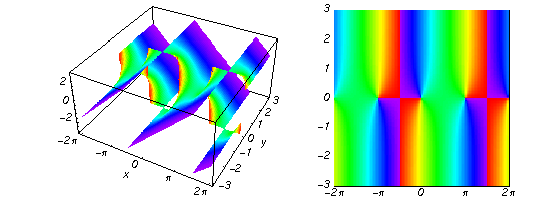
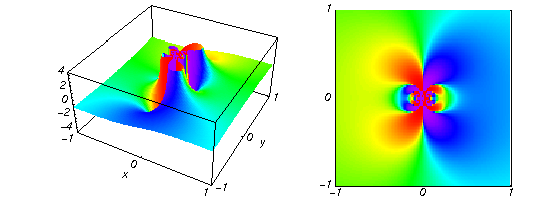
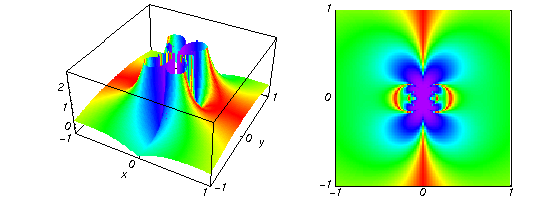
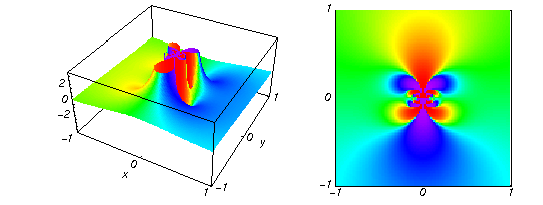
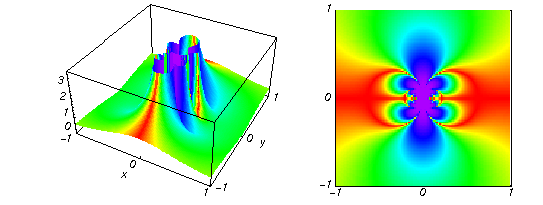
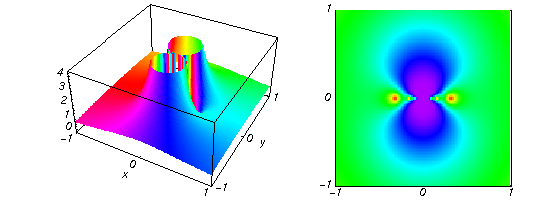
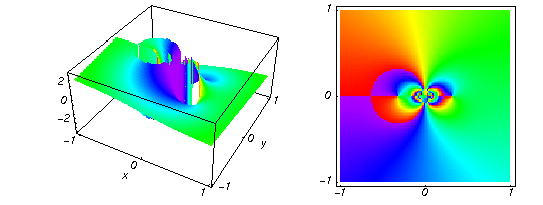
Real part over the complex plane The real part of  where where  . The surface is colored according to the imaginary part. The right graphic is a contour plot of the scaled real part, meaning the height values of the left graphic translate into color values in the right graphic. Red is smallest and violet is largest. Along the real axis, . The surface is colored according to the imaginary part. The right graphic is a contour plot of the scaled real part, meaning the height values of the left graphic translate into color values in the right graphic. Red is smallest and violet is largest. Along the real axis,  is oscillating; going away from the real axis into the is oscillating; going away from the real axis into the  its absolute value is generically an exponentially increasing function. its absolute value is generically an exponentially increasing function. The absolute value of the real part of  where where  . The surface is colored according to the absolute value of the imaginary part. The right graphic is a contour plot of the scaled absolute value of the real part, meaning the height values of the left graphic translate into color values in the right graphic. Red is smallest and violet is largest. Along the real axis, . The surface is colored according to the absolute value of the imaginary part. The right graphic is a contour plot of the scaled absolute value of the real part, meaning the height values of the left graphic translate into color values in the right graphic. Red is smallest and violet is largest. Along the real axis,  is oscillating; going away from the real axis into the is oscillating; going away from the real axis into the  its absolute value is generically an exponentially increasing function. Along the lines its absolute value is generically an exponentially increasing function. Along the lines  with with  , the real part of , the real part of  vanishes identically. vanishes identically. Imaginary part over the complex plane The imaginary part of  where where  . The surface is colored according to the real part. The right graphic is a contour plot of the scaled imaginary part, meaning the height values of the left graphic translate into color values in the right graphic. Red is smallest and violet is largest. On the real axis, the imaginary part vanishes identically, and going away from the real axis into the . The surface is colored according to the real part. The right graphic is a contour plot of the scaled imaginary part, meaning the height values of the left graphic translate into color values in the right graphic. Red is smallest and violet is largest. On the real axis, the imaginary part vanishes identically, and going away from the real axis into the  its absolute value is generically an exponentially increasing function. its absolute value is generically an exponentially increasing function.  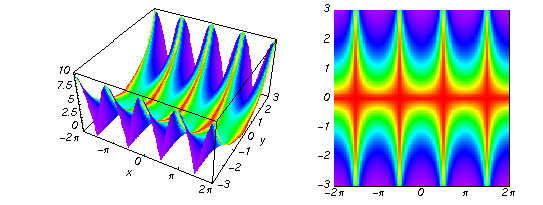 |
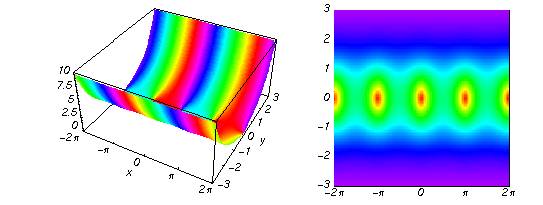
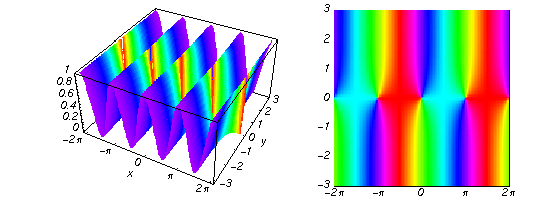
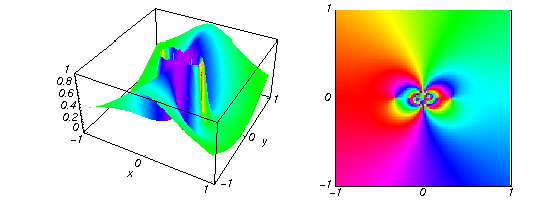
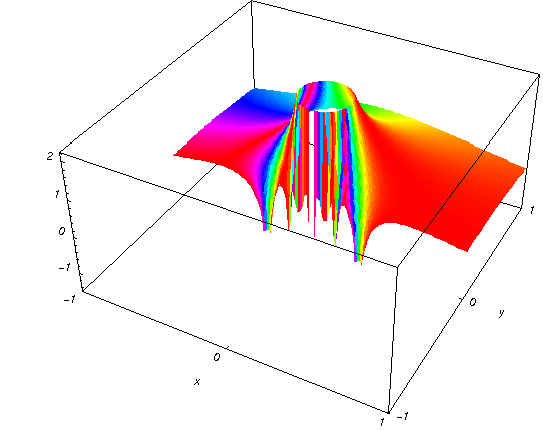
The absolute value of the imaginary part of  where where  . The surface is colored according to the absolute value of the real part. The right graphic is a contour plot of the scaled absolute value of the imaginary part, meaning the height values of the left graphic translate into color values in the right graphic. Red is smallest and violet is largest. On the real axis, the imaginary part vanishes identically, and going away from the real axis into the . The surface is colored according to the absolute value of the real part. The right graphic is a contour plot of the scaled absolute value of the imaginary part, meaning the height values of the left graphic translate into color values in the right graphic. Red is smallest and violet is largest. On the real axis, the imaginary part vanishes identically, and going away from the real axis into the  its absolute value is generically an exponentially increasing function. Along the lines its absolute value is generically an exponentially increasing function. Along the lines  with with  , the real part of , the real part of  vanishes identically. vanishes identically. Absolute value part over the complex plane The absolute value of  where where  . The surface is colored according to the argument. The right graphic is a contour plot of the scaled absolute value, meaning the height values of the left graphic translate into color values in the right graphic. Red is smallest and violet is largest. Along the real axis . The surface is colored according to the argument. The right graphic is a contour plot of the scaled absolute value, meaning the height values of the left graphic translate into color values in the right graphic. Red is smallest and violet is largest. Along the real axis  is bounded; going away from the real axis gives a exponentially increasing function. The zeros at is bounded; going away from the real axis gives a exponentially increasing function. The zeros at  , ,  are clearly visible. are clearly visible. Argument over the complex plane The argument of  where where  . The surface is colored according to the absolute value. The right graphic is a contour plot of the scaled argument, meaning the height values of the left graphic translate into color values in the right graphic. Red is smallest and violet is largest. . The surface is colored according to the absolute value. The right graphic is a contour plot of the scaled argument, meaning the height values of the left graphic translate into color values in the right graphic. Red is smallest and violet is largest.  has lines of discontinuities over the has lines of discontinuities over the  . . The square of the sine of the argument of  where where  . For dominantly real values, the function values are near 0, and for dominantly imaginary values, the function values are near 1. The surface is colored according to the absolute value. The right graphic is a cyclically colored contour plot of the argument. Red represents arguments near . For dominantly real values, the function values are near 0, and for dominantly imaginary values, the function values are near 1. The surface is colored according to the absolute value. The right graphic is a cyclically colored contour plot of the argument. Red represents arguments near  and light‐blue represents arguments near 0. and light‐blue represents arguments near 0. Zero-pole plot The logarithm of the absolute value of  where where  in the upper half‐plane. The surface is colored according to the square of the argument. In this plot zeros are easily visible as spikes extending downwards and poles as spikes extending upwards. in the upper half‐plane. The surface is colored according to the square of the argument. In this plot zeros are easily visible as spikes extending downwards and poles as spikes extending upwards. Real part over the complex plane near infinity The real part of  where where  . The surface is colored according to the imaginary part. The right graphic is a contour plot of the scaled real part, meaning the height values of the left graphic translate into color values in the right graphic. Red is smallest and violet is largest. The essential singularity at . The surface is colored according to the imaginary part. The right graphic is a contour plot of the scaled real part, meaning the height values of the left graphic translate into color values in the right graphic. Red is smallest and violet is largest. The essential singularity at  results in a complicated structure there. results in a complicated structure there. The absolute value of the real part of  where where  . The surface is colored according to the absolute value of the imaginary part. The right graphic is a contour plot of the scaled absolute value of the real part, meaning the height values of the left graphic translate into color values in the right graphic. Red is smallest and violet is largest. The essential singularity at . The surface is colored according to the absolute value of the imaginary part. The right graphic is a contour plot of the scaled absolute value of the real part, meaning the height values of the left graphic translate into color values in the right graphic. Red is smallest and violet is largest. The essential singularity at  results in a complicated structure there. results in a complicated structure there. Imaginary part over the complex plane near infinity The imaginary part of  where where  . The surface is colored according to the real part. The right graphic is a contour plot of the scaled imaginary part, meaning the height values of the left graphic translate into color values in the right graphic. Red is smallest and violet is largest. The essential singularity at . The surface is colored according to the real part. The right graphic is a contour plot of the scaled imaginary part, meaning the height values of the left graphic translate into color values in the right graphic. Red is smallest and violet is largest. The essential singularity at  results in a complicated structure there. results in a complicated structure there. The absolute value of the imaginary part of  where where  . The surface is colored according to the absolute value of the real part. The right graphic is a contour plot of the scaled absolute value of the imaginary part, meaning the height values of the left graphic translate into color values in the right graphic. Red is smallest and violet is largest. The essential singularity at . The surface is colored according to the absolute value of the real part. The right graphic is a contour plot of the scaled absolute value of the imaginary part, meaning the height values of the left graphic translate into color values in the right graphic. Red is smallest and violet is largest. The essential singularity at  results in a complicated structure there. results in a complicated structure there. Absolute value part over the complex plane near infinity The absolute value of  where where  . The surface is colored according to the argument. The right graphic is a contour plot of the scaled absolute value, meaning the height values of the left graphic translate into color values in the right graphic. Red is smallest and violet is largest. The essential singularity at . The surface is colored according to the argument. The right graphic is a contour plot of the scaled absolute value, meaning the height values of the left graphic translate into color values in the right graphic. Red is smallest and violet is largest. The essential singularity at  results in a complicated structure there. results in a complicated structure there. Argument over the complex plane near infinity The argument of  where where  . The surface is colored according to the absolute value. The right graphic is a contour plot of the scaled argument, meaning the height values of the left graphic translate into color values in the right graphic. Red is smallest and violet is largest. The essential singularity at . The surface is colored according to the absolute value. The right graphic is a contour plot of the scaled argument, meaning the height values of the left graphic translate into color values in the right graphic. Red is smallest and violet is largest. The essential singularity at  results in a complicated structure there. results in a complicated structure there. The square of the sine of the argument of  where where  . For dominantly real values, the function values are near 0, and for dominantly imaginary values, the function values are near 1. The surface is colored according to the absolute value. The right graphic is a cyclically colored contour plot of the argument. Red represents arguments near . For dominantly real values, the function values are near 0, and for dominantly imaginary values, the function values are near 1. The surface is colored according to the absolute value. The right graphic is a cyclically colored contour plot of the argument. Red represents arguments near  and light‐blue represents arguments near 0. and light‐blue represents arguments near 0. Zero-pole plot near infinity The logarithm of the absolute value of  where where  in the upper half‐plane. The surface is colored according to the square of the argument. In this plot zeros are easily visible as spikes extending downwards and poles as spikes extending upwards. The essential singularity at in the upper half‐plane. The surface is colored according to the square of the argument. In this plot zeros are easily visible as spikes extending downwards and poles as spikes extending upwards. The essential singularity at  results in a complicated structure there. results in a complicated structure there.
|